Chance News 55
Quotations
Populism, in its latest manifestation, celebrates ignorant opinion and undifferentiated rage. .... The typical opinion poll … doesn’t trouble to ask whether the respondent knows the first thing about the topic being opined upon, and no conventional poll disqualifies an answer on the ground of mere total ignorance. The premise of opinion polling is that people are, and of right ought to be, omni-opinionated – that they should have views on all subjects at all times – and that all such views are equally valid. …. So, given the prominence of polls in our political culture, it’s no surprise that people have come to believe that their opinions on the issues of the day need not be fettered by either facts or reflection. …. Now there’s the intellectual free lunch: I’m entitled to vociferous opinions on any subject, without having to know, or even think, about it.
We live in a world of real dangers and imagined fears. …. We are hounded by what I call “psycho-facts”: beliefs that, though not supported by hard evidence, are taken as real because their constant repetition changes the way we experience life. …. We act as if there’s a constitutional right to immortality and that anything that raises risk should be outlawed. ….
In a September 18 Statesman Journal story, “Ducks’ defense faces tough challenge”, a coach was quoted:
The only statistic that counts is winning and losing …. We don't get caught up in that. .... How many yards and those things.
A retiring associate professor of math at BVU was described in a Storm Lake Pilot Tribune article [1] of September 17:
His love for math outweighed his love of sports by a few percentage points.
The plain fact is that 70 years ago Ronald Fisher gave scientists
a mathematical machine for turning baloney into breakthroughs,
and flukes into funding. It is time to pull the plug.
Robert Mathews commenting on medical studies which have a low p-value and thus are statistically significant but subsequently turn out to be duds when expanded to the general population.
Submitted by Paul Alper.
Forsooths
Responding to a Canadian viewer who pointed out that "life expectancy in Canada under our health system is higher than the USA," Fox's Bill O'Reilly on 7/27/09 said,
Well, that's to be expected, Peter, because we have 10 times as many people as you do. That translates to 10 times as many accidents, crimes, down the line.
Note:(Laurie Snell). Norton Starr wrote us that a former student of his, Darius Lakdawalta,PH.D, who is now an Economist at USC, wrote the following remarks about O'reily's comments:
While O'Reilly is clueless, he is accidentally right about one thing:differences in life expectancy have very little to do with health care. There is a lot of research to substantiate this point today, but one of
the first people to observe it was an economist named Victor Fuchs, nearly 40 years ago.
Fuchs made a now-famous comparison between Nevada, and Utah, which has substantially higher life expectancy than its infamous neighbor. He showed that Utah and Nevada spent nearly identical amounts per capita on medical care, and attributed the gap to the "clean living" of the average Utah resident, as compared with the average Nevadan.
Similarly, smoking, obesity, and inequality in schooling, all have more to do with life expectancy than doctors and hospitals.
This is a point that is almost always lost in the hysteria over health reform. In fact, it is virtually impossible to demonstrate a causal link between health insurance and longevity, except for a few very
special groups (particularly the HIV+).
According to a September 18 FOX8 News WVUE-TV story, “Chance for rain”, the following information was published in a cover story in an early 2009 bulletin of the American Meteorological Society:
[Researchers at the University of Washington] found people in Seattle didn't have much of a grasp for what the probability forecast [of rain] really means, but found the numbers helpful in planning their day.
Hanna Karp, in “What’s the Point of Cheerleading?”, The Wall Street Journal, September 17, 2009, states:
Risk-assessment experts say it’s hard to get a handle on the perils of cheerleading.
An advertisement in The Wall Street Journal, of September 22, 2009, contained a chart with an interesting legend. See the chart “Effectiveness of virtual vs. in-person meetings,” in “The Return on Investment of U.S. Business Travel”, prepared by Oxford Economics USA, September 2009, document page 21/pdf page 20.
Students might find it challenging to describe in one sentence what it says. They also might be asked to re-create the chart so that it would convey the message more effectively, that is, pass the interocular trauma test.
Breaking News
The Wall Street Journal of September 8, 2009 reports on a study in the Journal of Bone and Joint Surgery: “The researchers compared the outcomes of patients who underwent surgery between 6 a.m. and 4 p.m. for fractures of the femur or tibia to those who had comparable surgeries for similar fractures outside those normal hours.”
| Sample | Reoperations Needed |
Sample Size |
Sample Proportion |
|
| Outside Normal Hours | 28 |
82 |
.3415 | |
| Within Normal Hours | 12 |
70 |
.1714 |
The results are:
Difference = p (1) - p (2) Estimate for difference: 0.170035 95% CI for difference: (0.0346494, 0.305420) Test for difference = 0 (vs not = 0): Z = 2.37 P-Value = 0.018
Fisher's exact test: P-Value = 0.026
Discussion
1. Why is the Fisher exact test P-Value (0.026) to be preferred to the other P-Value mentioned (0.018)?
2. The Wall Street Journal mentioned several caveats “making it difficult to determine the underlying reasons for the after-hours patients’ poor outcomes.” List a few practical significance hedges to the statistically significant result.
Submitted by Paul Alper.
Amazon River at age 1,000,003 years
“Metrics mania: Are Americans too reliant on numbers?”
by John Yemma, The Christian Science Monitor, September 16, 2009
The author first reminds readers of an old joke:
A guy strikes up a conversation with another guy on a long plane flight to South America. They are over the Amazon.
Guy 1: “Did you know that the Amazon is 1,000,003 years old?”
Guy 2: “Really? How can you be so precise?”
Guy 1: “I was on this same flight three years ago, and a geologist told me the Amazon was a million years old.”
He then discusses the difficulty with “metrics-based management” efforts, but concludes, in a hopeful vein, with a formula and some encouragement:
Metrics + Grain of Salt = Somewhat Useful Information.
Still, even if we can’t trust data absolutely, we can extract meaning. We may not know how old the Amazon really is, but we know one thing for certain: It is three years older than when Guy 1 first flew over it.
A blogger comments [2],
So true. I am an European who has lived in the US for almost 20 years. I am constantly amazed at the ‘number obsession’ that seems to rule all areas of society. It may be because this country is so big, that a common measure can only be found in quantities, not qualities.
Gompertz Law of human mortality
“You’re Likely to Live!”
by “Freakonomics,” The New York Times, September 14, 2009
This very brief article describes the “Gompertz Law of human mortality,” provides some statistics about the different chances of dying at different ages, and refers readers to three websites:
(a) Article with Gompertz Law details and graphs: “Your body wasn’t built to last: a lesson from human mortality rates”, "gravity and levity" blog, July 8, 2009.
(b) Applet that gives life expectancy at user-selected age: “Death Probability Calculator”, undated.
(c) TED video of songs, the first of which relates to aging: “Time is marching on”, March 2007.
Things that go bump
“Bumped Passengers Learn a Cruel Flying Lesson”
by Scott McCartney, The Wall Street Journal, September 17, 2009
This article discusses the recent spike in the rates of passenger-bumping by airlines, despite the increased penalties that the federal government requires the airlines to pay bumped-but-ticketed passengers. Although bumping affects fewer than 2 passengers out of every 10,000, that rate rose by 40% in the second quarter of 2009 over the rate for the second quarter of 2008.
It's pretty simple: It's just because planes are more full than last year," says [a US Airways official, whose airline] had the highest bumping rate among major airlines, at 1.88 passengers per 10,000 in the second quarter.
This summer, the nine major airlines filled 85.5% of their seats, up from 84.1% last summer. The peak was July, with 86.7% of seats filled.
Federal rules allow airlines to overbook in order to compensate for no-shows. The recent increase in bumping rates may be explained by the reduced demand for air travel, especially by business customers.
The [Department of Transportation] says it isn't concerned about the rise in bumping because the rates are still lower than historical highs. During the 1970s and 1980s, bumping rates were routinely four times as high as today's rate.
Discussion
Suppose that, on average, 85% of ticket-holders show up for their flights. Assume that the distribution of the number of ticket-holders who show up is binomial (especially that every ticket-holder has the same chance of being bumped) and that a ticket-holder is bumped only due to lack of a seat.
1. For each n tickets sold, or over-sold, for a 200-seat plane, find the number of ticket-holders an airline could expect to show up, on average.
(a) n = 200 (b) n = 210 (c) n = 220 (d) n = 230 (e) n = 240 (f) n = 250.
2. It appears that the airline would not have to bump any ticket-holders for some values of n. Is that a statistically correct inference, based on your understanding of expected value? Even if those expected values always “came true,” what problem would remain for the airline?
3. For each n tickets sold, or over-sold, find the probability of at least one ticket-holder being bumped off the 200-seat plane.
(a) n = 200 (b) n = 210 (c) n = 220 (d) n = 230 (e) n = 240 (f) n = 250.
4. For which value(s) of n would you have a negligible risk of being bumped? Under what circumstances might any risk be too great?
5. The more tickets an airline sells, the more likely it is to fill the plane and thus maximize its revenue for a flight. However, at some point, the increased revenue may be offset by losses of future dollars from angry ticket-holders and compensation payouts to increasing numbers of bumped ticket-holders. What other information would you want/need to know before deciding how many tickets to sell for a 200-seat plane?
6. Do you agree with the "pretty simple" reason given for the increased rate of bumping?
The Bulgarian Toto 6 of 42 lottery
The Bulgarian Toto 6 of 42 lottery was the subject of an investigation after the same set of six numbers {4, 15, 23, 24, 35, 42} was drawn in two successive lotteries on September 6 and September 10, 2009. The article [3] cites a mathematician as stating that the probability of picking the same six numbers twice in a row is 4,200,000:1. We wondered how he arrived at this number. What is the probability that a specified set of six numbers will repeat consecutively?
There are <math>{42 \choose 6} = 5245786</math> different sets of six numbers and the probability that a SPECIFIED set will occur in the next two consecutive draws is <math>1/5245786^2</math>. Because the sets involve disjoint events, the probability that SOME set will occur in the next two consecutive draws is <math>5245786 \times 1/5245786^2 = 1/5245786</math>.
But now, suppose the lottery has been running continuously for <math>m</math> draws and we ask what the chance is that during this period there were consecutive draws of the same set. As before, first consider a fixed set of six numbers.
There are <math>m-1</math> opportunities for this set to be drawn twice in succession (beginning with the second drawing). The probability that this will happen is then the probability of the union <math>P(A) = P(\cup_i A_i A_{i+1}) </math> where <math>A_i</math> is the event that this set of numbers is drawn on the ith draw.
Bonferroni's first degree upper bound is <math>P(A) \le \sum_{1 \le i \le m-1} P(A_i A_{i+1})</math> while the second degree lower bound is <math>P(A) \ge \sum_{1 \le i \le m-1}P(A_i A_{i+1}) - \sum_{1 \le i < j \le m-1}P(A_i A_{i+1} A_j A_{j+1}).</math>
We assume (!) that the events <math>A_i</math> are independent and identically distributed with probability <math>p = 1/5245786</math>. As long as <math>mp</math> is small the second sum in the lower bound can be ignored, giving <math>P(A) \approx (m-1)/5245786^2.</math>
It appears that the draws are held twice per week so for one year <math>m = 104</math> giving the probability <math>3.74 \times 10^{-12}</math> that a specified set of numbers will be drawn twice in succession. According to a spokeswoman the lottery has been taking place for 52 years [4]. Using <math>m = 104 \times 52 = 5408</math>, the probability that a specified set of numbers will be drawn twice in succession over this period is <math>1.89 \times 10^{-10}</math>, still very small.
But now let's ask the question, not for a fixed set of numbers but for some set of numbers. After all, in discussing this coincidence the repeated set arises by chance alone and is not specified in advance.
In <math>m</math> drawings what is the probability that SOME set of six numbers will be repeated in consecutive draws?
There are 5245786 possible sets of numbers that could be repeated. Enumerate the sets by integers <math>1 \le k ≤ \le 5245786</math> with <math>E_k</math> the event that set <math>k</math> repeats consecutively sometime during these <math>m</math> drawings. The probability of the union <math>P(\cup E_k)</math> is needed. Each of the 5245786 events <math>E_k</math> has probability <math>(m-1)/ 5245786^2</math> and if they were independent we could evaluate the probability using complements as <math>P(\cup E_k) = 1 - (1- (m-1)/5245786^2)^{5245786} \approx 1 - e^{-(m-1)/5245786}</math>. However, they are dependent, but as long as <math>mp</math> is small Bonferroni's bounds can once again be used to estimate <math>P(\cup E_k) \approx (m-1)/5245786.</math> For <math>m = 5408</math> this is 0.0010302. (Note that assuming independence gives 0.0010307.)
This probability relates to one lottery. Suppose we consider all lotteries worldwise and ask for the probability that in some lottery, somewhere, some set of numbers will be repeated consecutively. All lotteries are variants of Toto with different numbers involved. Each lottery will have had its own cumulative number of drawings. In order to gauge the magnitude of the probability wanted, assume that there are <math>x</math> lotteries, each one sharing the same numerical characteristics as the Bulgarian one.
This time we can use independence. The probability that some set will be repeated is 1 minus the probability that in no lottery is a set of numbers selected on two consecutive drawings <math>= 1 - (1 - (m -1)/5245786)^x</math>. For <math>x = 50</math> this is 0.0503 while for <math>x = 100</math> the probability is 0.0980. (An approximation to one significant digit for this range of values of interest is <math>x(m-1)/5245786.</math>)
For a different problem that discusses "very big numbers" see the article about double lottery winners [5].
Questions.
1. Can you verify both assertions concerning the Bonferroni lower bound.
2. How many years would the Bulgarian lottery need to be running in order to have the same probability that some set of numbers will appear three times in succession?
3. Instead of demanding that the same set of numbers appear twice in succession, what is the probability that some set of numbers will repeat during <math>m</math> drawings? (This is simpler and is the famous birthday problem)
Submitted by Fred Hoppe
Baby, it’s cold outside
“New Light on the Plight of Winter Babies”
by Justin Lahart, The Wall Street Journal, September 22, 2009
Two Notre Dame economists “may have uncovered an overlooked explanation for why season of birth matters” with respect to the often reported poor test results, less healthiness, reduced longevity, and lower school completion rates and earnings of children born in the winter. See “Season of Birth and Later Outcomes: Old Questions, New Answers”, by Kasey Buckles and Daniel Hungerman, National Bureau of Economic Research, December 2008.
Working independently, Hungerman found that “children in the same families tend to be born at the same time of year,” and Buckles found a “tendency that less educated mothers were having children in winter.” They put their heads together and concluded that:
A key assumption of much of [the previous] research is that the backgrounds of children born in the winter are the same as the backgrounds of children born at other times of the year.
Some previous explanations for seasonal birth differences were school attendance laws, the amount of sunshine available in a season, or the level of pesticides in the water in a season. With respect to the first explanation, economists Joshua Angrist of MIT and Alan Krueger of Princeton posited in 1991 that, since winter babies can drop out of school earlier because they reach their 16th birthdays earlier, those babies have lower education levels that, in turn, lead to lower earnings.
Upon examination of CDC birth-certificate data for virtually all 52 million children born during the period 1989-2001, the Notre Dame researchers noted:
The percentage of children born to unwed mothers, teenage mothers and mothers who hadn't completed high school kept peaking in January every year. Over the 13-year period, for example, 13.2% of January births were to teen mothers, compared with 12% in May -- a small but statistically significant difference, they say.
A Columbia University economist comments about how striking the Notre Dame results are: "You can take a look at those graphs and see the clear pattern and that it's remarkably stable over time." See graphs [6] of January and May births with respect to birth mother’s marital status, age, and education.
Angrist disagrees, stating "The bottom line is a slight change in the estimate. …. It hardly overturns our finding."
Buckles and Hungerman are now working on finding an explanation of why a mother’s socioeconomic status is related to a child’s birth month.
(As of September 24, there were 298 blogs [7] responding to this article!)
U.S. Census: 2008 sampling results released
The U.S. Census Bureau has released the 2008 results of its ongoing "American Community Survey".
Tennis challenges are underused
Challenge, Anyone? Paul Kedrosky, The New York Times, September 20, 2009
It seems like economists have an opinion about just about everything. Paul Kedrosky, described in the New York Times as "senior fellow at the Kauffman Foundation, a center for economic research," has advice for professional tennis players. Challenge the line judges more often.
Like in American football, tennis players can challenge a judges ruling.
Here’s how challenges work. Major tennis tournaments (like the U.S. Open) have multiple cameras arrayed around the court. This permits a simulated replay of a shot, showing to the millimeter where a ball landed on the court. So instead of futilely shouting, "You can't be serious!" at linesmen and umpires, players can raise their hand immediately after a call and ask for a replay.
There are limits to how often you can challenge.
The rules allow three incorrect challenges per player per set. In a best-of-five-sets match (which is normal for men), that means at least 18 available challenges per match, none of which carry over from set to set.In other words, use ’em or lose ’em. A player can get an additional challenge if the match goes into a tiebreaker, or if a fifth set goes overtime.
But most tennis players don't come even close to using all of their available challenges. And they should according to Kedrosky. Here's one scenario he proposes:
For example, the No. 10 seed at the Open, Fernando Verdasco of Spain, averaged 0.4 challenges per set and had a sparkling 43 percent success rate. If he challenged once per set, like Federer, and his challenge success rate fell to a similar 30 percent, it could mean one more point to him in a three-set match. If his success rate didn’t fall as much, however, and he challenged twice per set it might mean as many as three more points in a five-set match. Either way, it could be the difference between winning and losing.
There are other factors at work, such as embarrassment when a challenge does not go your way, but Kedrosky thinks players should ignore this.
Submitted by Steve Simon
Questions
1. Suppose you wanted to run a computer simulation about close calls in tennis and vary the rate at which players challenge close calls. What are some of the rnadom variables that you would have to account for in such a simulation?
2. How much of an edge would one more point mean in a match between two players who are otherwise evenly matched?
Netflix data mining contest
A $1 Million Research Bargain for Netflix, and Maybe a Model for Others Steve Lohr, The New York Times, September 21, 2009.
Netflix Awards $1 Million Prize and Starts a New Contest Steve Lohr, Bits Blog, The New York Times, September 21, 2009.
Netflix just awarded a million dollar prize in a contest to build a data mining model that could predict what movies its customers would like to see. There was a tight competition between two teams. The winning team, BellKor’s Pragmatic Chaos, was a group of seven "statisticians, machine-learning experts and computer engineers from the United States, Austria, Canada and Israel". The second place team, Ensemble, was "a global alliance with some 30 members."
The losing team, as it turned out, precisely matched the performance of the winner, but submitted its entry 20 minutes later, just before the final deadline expired. Under contest rules, in the event of a tie, the first team past the post was the winner. “That 20 minutes was worth a million dollars,” Reed Hastings, chief executive of Netflix, said at a news conference in New York.
Netflix has already improved its system to help customers pick movies and thinks the million dollar investment was well spent.
Thousands of teams from more than 100 nations competed in the Netflix prize contest. And it was a good deal for Netflix. “You look at the cumulative hours and you’re getting Ph.D.’s for a dollar an hour,” Mr. Hastings said in an interview.
The losing team was not too upset.
Yet the scientists and engineers on the second-place team, and the employers who gave many of them the time and freedom to compete in the contest, were hardly despairing. Arnab Gupta, chief executive of Opera Solutions, a consulting company that specializes in data analytics, based in New York, took a small group of his leading researchers off other work for two years. "We've already had a $10 million payoff internally from what we’ve learned," Mr. Gupta said. Working on the contest helped the researchers come up with improved statistical analysis and predictive modeling techniques that his firm has used with clients in fields like marketing, retailing and finance, he said. "So for us, the $1 million prize was secondary, almost trivial."
The data set itself was the true prize to many team members.
Win or lose, researchers agreed that they entered the contest in good part to get access to the Netflix data. "It was incredibly alluring to work on such a large, high-quality data set," said Joe Sill, an independent consultant and machine-learning expert who was a member of the Ensemble.
Submitted by Steve Simon
See the Netflix Prize website [8] for the winning algorithm, and watch the website for information about the 2nd contest.
Flu Shots
The Wall Street Journal of September 24, 2009 reports on a study in the current issue of the New England Journal of Medicine dealing with the efficacy of flu shots during the “2007-2008 flu season.” There were “1952 healthy adults who received either a placebo or one of two [types of] vaccinations,” either a shot or a spray.
“Of the 813 volunteers who received the flu shot, 28 of them or 3.4%, later developed a confirmed case of influenza. In the FluMist group; 56 of the 814 volunteers, or 6.9% developed the flu, while 10.8% of the placebo group had confirmed flu cases.”
Discussion
1. Here is the Minitab output for the comparison between the two forms of vaccination:
Test and CI for Two Proportions
| Sample | X | N | Sample p |
| 1 | 56 | 814 | 0.068796 |
| 2 | 28 | 813 | 0.034440 |
Difference = p (1) - p (2)
Estimate for difference: 0.0343557
95% CI for difference: (0.0129208, 0.0557907)
Test for difference = 0 (vs not = 0): Z = 3.14 P-Value = 0.002
Fisher's exact test: P-Value = 0.002
How does this output support the conclusion that the shot works better than the spray?
2. Because the number of volunteers is 1952 and the total number in the control arms is 1627 (814 + 813), the number of volunteers who received the placebo is 325. Below is the Minitab output comparing the controls vs. the placebo:
Test and CI for Two Proportions
| Sample | X | N | Sample p |
| 1 | 35 | 325 | 0.107692 |
| 2 | 84 | 1627 | 0.051629 |
Difference = p (1) - p (2)
Estimate for difference: 0.0560635
95% CI for difference: (0.0206880, 0.0914391
Test for difference = 0 (vs not = 0): Z = 3.86 P-Value = 0.000
Fisher's exact test: P-Value = 0.000
How does this support the conclusion that the vaccinations work better than the placebo?
3. According to the article, the makers of the shot, Sanofi Pasteur, “provided funding for the study” and the lead author “reports receiving lecture fees from the company.” No mention is made of MedImmune Inc., makers of the spray. How does this modify your conclusions?
4. Roughly 5% (84 of 1627) of those who received a vaccination still became confirmed flu victims. Find a friendly librarian to determine how this compares with vaccinations for other diseases such as measles, mumps, rubella, chicken pox and shingles.
Submitted by Paul Alper
Adverse event or just a normal part of life
Don’t Blame Flu Shots for All Ills, Officials Say, Donald G. McNeil Jr. The New York Times, September 27, 2009
Another aspect of flu shots is the media coverage of adverse events.
Every year, there are 1.1 million heart attacks in the United States, 795,000 strokes and 876,000 miscarriages, and 200,000 Americans have their first seizure. Inevitably, officials say, some of these will happen within hours or days of a flu shot.
If some of these events are noted in the media, will the press overreact? If history is a guide, the answer is yes.
In the opening days of the 1976 vaccination campaign, which eventually vaccinated 45 million Americans, three elderly Pittsburgh residents died soon after receiving their shots at the same clinic. Though scientists believe it was just a freakish coincidence, some news reports suggested the vaccine had killed them. "Press frenzy was so intense it drew a televised rebuke from Walter Cronkite for sensationalizing coincidental happenings," Dr. David J. Sencer, who was then the director of the C.D.C., wrote in 2006 reflections on the vaccination campaign.
The CDC is collecting data to try to sort out the unfortunate events that are just a normal part of life from the adverse events that could serve as an early warning of problems with the vaccine.
To defend itself, Dr. Butler said, the C.D.C, has compiled data on how many problems like heart attacks, strokes, miscarriages, seizures and sudden infant deaths normally occur. And it has broken those figures down for various high-priority vaccine groups, like pregnant women or children with asthma. When vaccinations begin, it plans to gather reports from vaccine providers, hospitals and doctors, looking for signs of adverse events, so it can detect problems before rumors grow. "Then we'll try to verify the signal, see if it's real," Dr. Butler said. "Then we'll try to see if it's associated with the vaccine. If it is, we'll say so. The process will be as transparent as we can make it."
Submitted by Steve Simon
Questions
1. The data the CDC is collecting would be considered a historical control group. Why would the CDC use a historical control group instead of a randomized control group?
2. What causes the media to overreact and to sensationalize adverse events?
Poetic Chinese Statisticians
The Wall Street Journal tends to reserve its first page’s middle of the bottom for less weighty and often bizarre news items. The headline for the Saturday/Sunday edition, September 26-27, 2009 is, “As Communist China Turns Sixty, Her Statisticians Turn to Poetry.”[9] A featured poem by a Chinese statistician is entitled, “Love the Motherland, Love Statistics.” The poem reads (in translation),
On the website of China’s National Bureau of Statistics can be found “I am Proud to be a Brick in the Statistics Building of the Republic.” The following poem ends the WSJ article:
Discussion
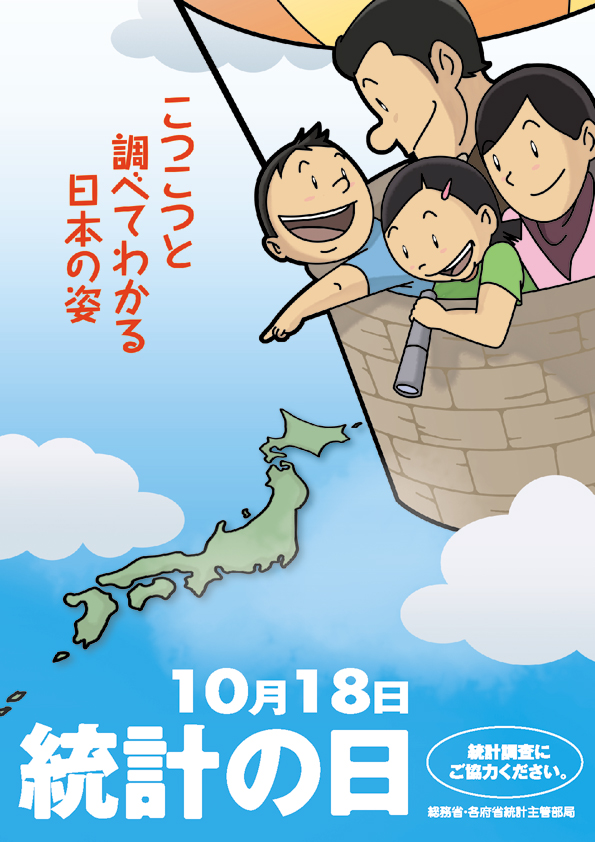
On October 18, Japan will observe the 37th anniversary of “Statistics Day.” Its purpose as described here was to strengthen “the national concern and understanding to the importance of statistics and promoting their cooperation in the surveys held by the central and local governments.” According to Andrew Malcolm writing in the New York Times on October 26, 1977 (“Data-Loving Japanese Rejoice on Statistics Day”), “no nation ranks higher in its collective passion for statistics. In Japan, statistics are the subject of holidays, local and national conventions, award ceremonies and nationwide statistical collection and graph-drawing contests.” On the 30th anniversary in 2002, the “catchphrase” selected from “among 2,934” submissions was "Statistical Surveys Owe You and You Owe Statistical Data." The poster used in publicity is shown below. Speculate on whether in the United States there ever will be statisticians writing patriotic poetry and/or a national statistics day.
Submitted by Paul Alper
Data mashing
DataMasher [10] is an online software product that enables folks to visualize the results of combining data sets. Users can “combine different data sets in interesting ways and create their own custom rankings of the states.” The purpose is “having fun and provoking discussions and avenues for more rigorous inquiry, not doing serious social science.”
The data are from credited U.S. governmental sources, and results are reported in tables and displayed in maps.
While some of the mashups may be solid indicators and demonstrate real correlations, other mashups may be complete nonsense …. Additionally, the mashups are only as good as the underlying data, which may or may not be strong enough for the relationship you're trying to explore.
One can create a mashup or view previously submitted ones. Registration is free.